A peak is a clue. Damping needs a method.
Quick answer
Identify resonances on a suitable frequency-response or amplitude curve, then estimate damping with a documented method. For a lightly damped, isolated mode, the half-power bandwidth gives an approximate Q and damping ratio. A response peak alone is not enough to establish a structural change.
Method
Identify the excitation axis, response channel, units, sweep direction, sweep rate and acquisition processing. Use amplitude data, not a PSD, for the classic sine-sweep half-power method.
Align measured response and control/input data in frequency. Form response/input transmissibility where appropriate for your analysis, rather than treating an input-profile change as a resonance. An FRF using measured force is a different quantity; label it correctly.
Find local maxima with documented frequency bounds and selection rules. Exclude invalid samples, saturation and controller artefacts.
For an isolated, lightly damped mode on an appropriate magnitude curve, identify the two frequencies f1 and f2 at the half-power level. On an amplitude curve that level is peak divided by sqrt(2) (about 3 dB below the peak). On a PSD it is half the peak (also about 3 dB, because a PSD is already power). Interpolate crossings within valid measured data.
Estimate Q ≈ fn/(f2 − f1) and damping ratio ζ ≈ (f2 − f1)/(2fn), where fn is approximated by the resonance frequency for light damping. Report the method and frequency resolution with the estimates. Do not report a number if both crossings are not resolved.
Limitations
The simple bandwidth relationships are approximations for suitable lightly damped single-mode responses. Base-excited acceleration transmissibility can have a non-flat numerator and background contribution, so do not apply the formula blindly. Closely spaced modes, nonlinear response, coarse resolution, high damping, noise, notching, rapid sweeps and transients can invalidate the estimate. Compare up/down sweeps and repeated runs where available. A Q taken from a response PSD is only approximate, because peak width also depends on the input spectrum and analysis resolution.
How TDC helps
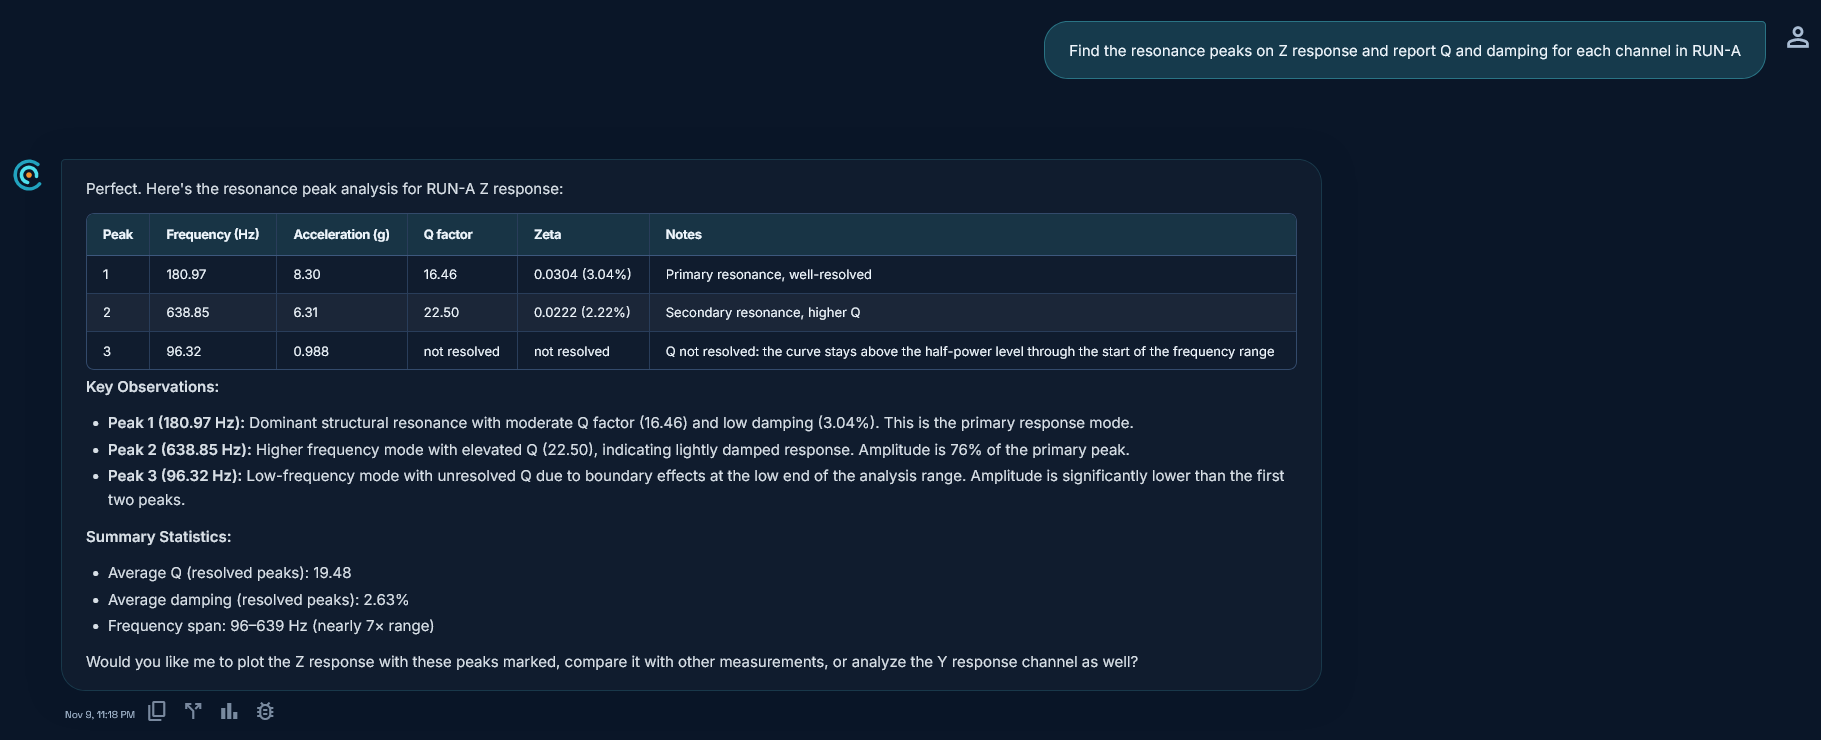
TDC accepts CSV, TSV, XLS, XLSX, UNV and UFF vibration test files. It applies the half-power method to the measured channel (no response/input transmissibility): peak divided by sqrt(2) on sine amplitude channels, and peak divided by 2 on random-vibration PSD channels, labelled as an approximate Q from the response PSD. Crossings are linearly interpolated; if the curve does not fall to the half-power level on both sides, TDC reports "not resolved" instead of a number. Values are computed in code from measured data, not invented by AI.
Request access to TDC at https://oxorigin.com/products/tdc or contact@oxorigin.com.
Example
Simulated sine resonant search, pre-test Run A, Z response with modes near 181 Hz and 639 Hz.
"Find the resonance peaks on Z response and report Q and damping for each channel in RUN-A"