Compare like with like before calling it a change.
Quick answer
Compare matching response channels from equivalent tests using the same units, input level and processing. Overlay the measured input as well as the response, quantify changes in relevant frequency bands, and investigate acquisition or mounting differences before interpreting a shift as damage.
Method
Record test type, axis, sensor identity and location, calibration, mounting, fixture, input target and measured input. Separate sine amplitudes from random-test PSDs.
Check sample rates, frequency grids, resolution, averaging, windowing and filtering. For random data use consistent PSD estimation settings. Keep an audit trail of any preprocessing.
Overlay both response curves and measured input curves with clear labels and units. Compare only the common valid frequency range; do not extrapolate missing bands.
If resampling is needed, document interpolation. Preserve spectral area when integrating PSDs and do not smooth away narrow peaks merely to align curves.
Compare peak frequency and amplitude, relevant band levels and, for acceleration PSDs, integrated gRMS over identical bands. Calculate ratios only where the reference is above the noise floor. For decibels use 20 log10 for amplitude ratios and 10 log10 for PSD or power ratios. A percent change, (later − earlier) / earlier × 100, is also common when the same quantity is compared.
Separate absolute response changes from input changes. A response/input comparison can help in a suitable linear system, but label the transfer quantity and retain the absolute plots.
Report observations, uncertainty and follow-up checks rather than a pass/fail conclusion without agreed criteria.
Limitations
Different test levels can reveal nonlinear behaviour. Temperature, mounting, sensor orientation, fixture response and controller notching can all change a result. A peak shift is not proof of damage. Damping estimates need their own validated method. Do not compare RMS from a PSD with a sine peak amplitude as though they were the same quantity. Matching peaks by amplitude rank instead of by nearest frequency can pair different resonances and invent a false shift.
How TDC helps
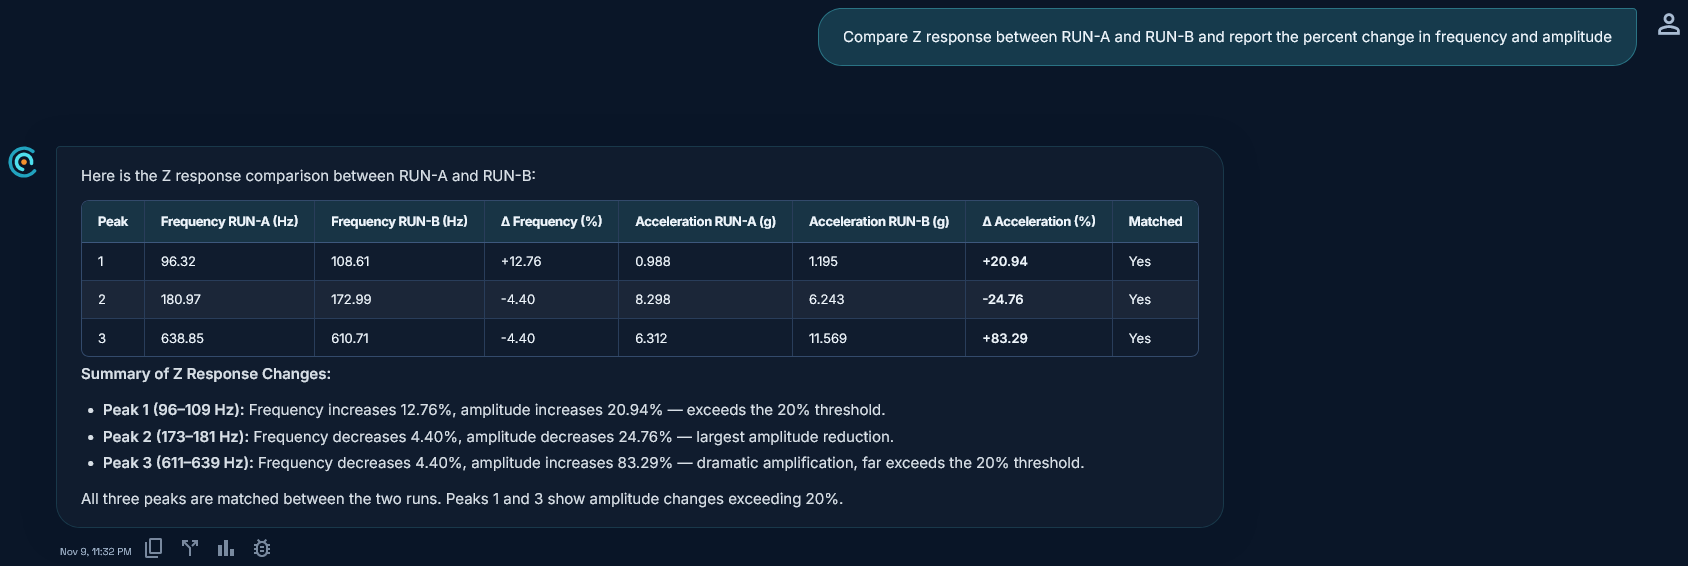
TDC accepts CSV, TSV, XLS, XLSX, UNV and UFF vibration test files. It pairs channels by name, matches the top peaks of each run (default 3) by nearest frequency, flags unmatched peaks, and reports the change in percent as (later − earlier) / earlier × 100. Values are computed in code from measured data, not invented by AI.
Request access to TDC at https://oxorigin.com/products/tdc or contact@oxorigin.com.
Example
Simulated sine resonant search: pre-test Run A and post-test Run B, Z response, with modes near 181 Hz and 639 Hz (peak height order swaps between runs).
"Compare Z response between RUN-A and RUN-B and report the percent change in frequency and amplitude"