gRMS means little without the frequency band.
Quick answer
For a one-sided acceleration power spectral density in g²/Hz, integrate the PSD over the chosen frequency band and take the square root. Overall gRMS uses the stated full analysis band. Peak-band gRMS uses explicitly defined bounds around a selected peak, not simply the peak height.
Method
Confirm the input is an acceleration PSD, not amplitude, ASD or decibel values. If it is ASD in g/√Hz, square it to obtain PSD before integration. Convert acceleration units consistently first.
Check one-sided/two-sided convention, spectral estimator, window normalization, frequency resolution and units. If generating a PSD from a time history, document detrending and filtering.
Define the overall band [fa, fb] before computing. Calculate gRMS = sqrt(∫ from fa to fb S_a(f) df). For sampled PSD density, use an integration method consistent with how it was generated. Trapezoidal integration can suit an exported continuous-density curve; a bin-power sum may suit an FFT-bin PSD; a log-log (power-law / breakpoint) integral between points suits many vibration-test profile and measured PSD files. Document endpoint treatment.
Find the highest valid PSD peak within a declared search band, excluding artefacts. Define a reproducible integration band around it, such as a fixed window about the peak frequency or surrounding valleys. Record exact bounds. Do not silently choose a band that favours a result.
Integrate the same PSD over those bounds and take the square root. Report overall gRMS, peak-band gRMS, both frequency bands and the method. For comparisons, use identical band definitions or explain tracking bands.
If checking against time-domain RMS, match the frequency band and filtering and account for estimator uncertainty and any removed DC content.
Limitations
PSD peak height is not RMS. Narrow lines, leakage, limited resolution, nonstationarity and overlapping modes affect interpretation. Band-limited gRMS includes all energy in the band, not just one mode. Half-power boundaries used for damping are not automatically appropriate energy-integration bounds. Do not integrate logarithmic display values directly, and do not add RMS values arithmetically; compatible uncorrelated band powers combine before taking the square root.
How TDC helps
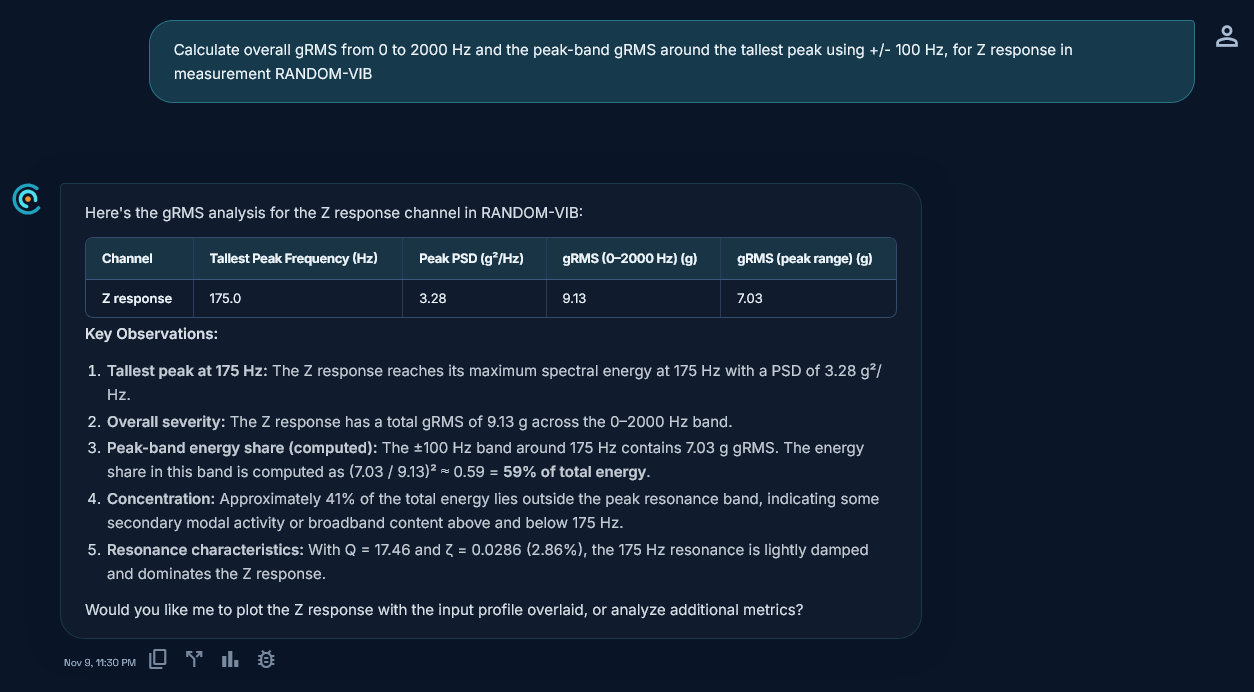
TDC accepts CSV, TSV, XLS, XLSX, UNV and UFF vibration test files. For a PSD it integrates between points as a straight line on a log-log plot (the usual breakpoint / dB-per-octave method), then takes the square root. Overall gRMS is reported over 0 to 2000 Hz; the peak-band value uses the tallest peak frequency plus or minus a window you choose (default 100 Hz). Values are computed in code from measured data, not invented by AI.
Request access to TDC at https://oxorigin.com/products/tdc or contact@oxorigin.com.
Example
Simulated random vibration response PSD with an input profile from 20 to 2000 Hz (measurement RANDOM-VIB, Z response).
"Calculate overall gRMS from 0 to 2000 Hz and the peak-band gRMS around the tallest peak using +/- 100 Hz, for Z response in measurement RANDOM-VIB"